JRuby memory leak hunting: Leaking in production
Again, we were runnning into a JRuby memory leak that I had to investigate, since it was affecting a customer environment in a bad way.
(The investigation started here at 2018-03-15, but was completed a few months later so if dates/etc seem weird here, it's because the post has been written at different times.)
I wasn't 100% sure, but I had a feeling that this could be the same issue as last time.
Step #1: Trying to acquire the dump, but failing
I tried first with jcmd:
root@my-docker-container:/dist# jcmd 72 GC.heap_dump java.hprof
72:
com.sun.tools.attach.AttachNotSupportedException: Unable to open socket file: target process not responding or HotSpot VM not loaded
    at sun.tools.attach.LinuxVirtualMachine.<init>(LinuxVirtualMachine.java:106)
    at sun.tools.attach.LinuxAttachProvider.attachVirtualMachine(LinuxAttachProvider.java:63)
    at com.sun.tools.attach.VirtualMachine.attach(VirtualMachine.java:208)
    at sun.tools.jcmd.JCmd.executeCommandForPid(JCmd.java:147)
    at sun.tools.jcmd.JCmd.main(JCmd.java:131)
Then again with jmap:
  root@my-docker-container:/dist# jmap -dump:format=b,file=heapdump-20180315 -F 72
Attaching to process ID 72, please wait...
Error attaching to process: Doesn't appear to be a HotSpot VM (could not find symbol "gHotSpotVMTypes" in remote process)
sun.jvm.hotspot.debugger.DebuggerException: Doesn't appear to be a HotSpot VM (could not find symbol "gHotSpotVMTypes" in remote process)
    at sun.jvm.hotspot.HotSpotAgent.setupVM(HotSpotAgent.java:412)
    at sun.jvm.hotspot.HotSpotAgent.go(HotSpotAgent.java:305)
    at sun.jvm.hotspot.HotSpotAgent.attach(HotSpotAgent.java:140)
    at sun.jvm.hotspot.tools.Tool.start(Tool.java:185)
    at sun.jvm.hotspot.tools.Tool.execute(Tool.java:118)
    at sun.jvm.hotspot.tools.HeapDumper.main(HeapDumper.java:83)
    at sun.reflect.NativeMethodAccessorImpl.invoke0(Native Method)
    at sun.reflect.NativeMethodAccessorImpl.invoke(NativeMethodAccessorImpl.java:62)
    at sun.reflect.DelegatingMethodAccessorImpl.invoke(DelegatingMethodAccessorImpl.java:43)
    at java.lang.reflect.Method.invoke(Method.java:498)
    at sun.tools.jmap.JMap.runTool(JMap.java:201)
    at sun.tools.jmap.JMap.main(JMap.java:130)
Could this be a conflict between the openjdk-8-jre-headless and
openjdk-8-jdk-headless packages? I tried uninstalling the first, but it
would try to uninstall the second also when doing so which I didn't like...
I restarted the Java process and retried. jcmd still failed, but jmap
would work somewhat better. It managed to connect to the process, but it
gave me the infamous "Metadata does not appear to be polymorphic" error.
root@my-docker-container:/dist# jmap -dump:format=b,file=heapdump-20180315 -F 31857
Attaching to process ID 31857, please wait...
Debugger attached successfully.
Server compiler detected.
JVM version is 25.131-b11
Dumping heap to heapdump-20180315 ...
Exception in thread "main" java.lang.reflect.InvocationTargetException
    at sun.reflect.NativeMethodAccessorImpl.invoke0(Native Method)
    at sun.reflect.NativeMethodAccessorImpl.invoke(NativeMethodAccessorImpl.java:62)
    at sun.reflect.DelegatingMethodAccessorImpl.invoke(DelegatingMethodAccessorImpl.java:43)
    at java.lang.reflect.Method.invoke(Method.java:498)
    at sun.tools.jmap.JMap.runTool(JMap.java:201)
    at sun.tools.jmap.JMap.main(JMap.java:130)
Caused by: java.lang.InternalError: Metadata does not appear to be polymorphic
    at sun.jvm.hotspot.types.basic.BasicTypeDataBase.findDynamicTypeForAddress(BasicTypeDataBase.java:278)
    at sun.jvm.hotspot.runtime.VirtualBaseConstructor.instantiateWrapperFor(VirtualBaseConstructor.java:102)
    at sun.jvm.hotspot.oops.Metadata.instantiateWrapperFor(Metadata.java:68)
    at sun.jvm.hotspot.memory.DictionaryEntry.klass(DictionaryEntry.java:71)
    at sun.jvm.hotspot.memory.Dictionary.classesDo(Dictionary.java:66)
    at sun.jvm.hotspot.memory.SystemDictionary.classesDo(SystemDictionary.java:190)
    at sun.jvm.hotspot.memory.SystemDictionary.allClassesDo(SystemDictionary.java:183)
    at sun.jvm.hotspot.utilities.HeapHprofBinWriter.writeClasses(HeapHprofBinWriter.java:954)
    at sun.jvm.hotspot.utilities.HeapHprofBinWriter.write(HeapHprofBinWriter.java:427)
    at sun.jvm.hotspot.tools.HeapDumper.run(HeapDumper.java:62)
    at sun.jvm.hotspot.tools.Tool.startInternal(Tool.java:260)
    at sun.jvm.hotspot.tools.Tool.start(Tool.java:223)
    at sun.jvm.hotspot.tools.Tool.execute(Tool.java:118)
    at sun.jvm.hotspot.tools.HeapDumper.main(HeapDumper.java:83)
    ... 6 more
This is the good old error from "More memory leaks: JVM and JRuby", but unfortunately the workaround suggested there did not work:
  root@my-docker-container:/dist# sudo -u ecraft jmap -dump:format=b,file=heapdump-20180315 -F 31857
Attaching to process ID 31857, please wait...
Error attaching to process: sun.jvm.hotspot.debugger.DebuggerException: Can't attach to the process: ptrace(`, ..) failed for 31857: Operation not permitted
sun.jvm.hotspot.debugger.DebuggerException: sun.jvm.hotspot.debugger.DebuggerException: Can't attach to the process: ptrace(PTRACE_ATTACH, ..) failed for 31857: Operation not permitted
    at sun.jvm.hotspot.debugger.linux.LinuxDebuggerLocal$LinuxDebuggerLocalWorkerThread.execute(LinuxDebuggerLocal.java:163)
    at sun.jvm.hotspot.debugger.linux.LinuxDebuggerLocal.attach(LinuxDebuggerLocal.java:278)
    at sun.jvm.hotspot.HotSpotAgent.attachDebugger(HotSpotAgent.java:671)
    at sun.jvm.hotspot.HotSpotAgent.setupDebuggerLinux(HotSpotAgent.java:611)
    at sun.jvm.hotspot.HotSpotAgent.setupDebugger(HotSpotAgent.java:337)
    at sun.jvm.hotspot.HotSpotAgent.go(HotSpotAgent.java:304)
    at sun.jvm.hotspot.HotSpotAgent.attach(HotSpotAgent.java:140)
    at sun.jvm.hotspot.tools.Tool.start(Tool.java:185)
    at sun.jvm.hotspot.tools.Tool.execute(Tool.java:118)
    at sun.jvm.hotspot.tools.HeapDumper.main(HeapDumper.java:83)
    at sun.reflect.NativeMethodAccessorImpl.invoke0(Native Method)
    at sun.reflect.NativeMethodAccessorImpl.invoke(NativeMethodAccessorImpl.java:62)
    at sun.reflect.DelegatingMethodAccessorImpl.invoke(DelegatingMethodAccessorImpl.java:43)
    at java.lang.reflect.Method.invoke(Method.java:498)
    at sun.tools.jmap.JMap.runTool(JMap.java:201)
    at sun.tools.jmap.JMap.main(JMap.java:130)
Caused by: sun.jvm.hotspot.debugger.DebuggerException: Can't attach to the process: ptrace(PTRACE_ATTACH, ..) failed for 31857: Operation not permitted
    at sun.jvm.hotspot.debugger.linux.LinuxDebuggerLocal.attach0(Native Method)
    at sun.jvm.hotspot.debugger.linux.LinuxDebuggerLocal.access$100(LinuxDebuggerLocal.java:62)
    at sun.jvm.hotspot.debugger.linux.LinuxDebuggerLocal$1AttachTask.doit(LinuxDebuggerLocal.java:269)
    at sun.jvm.hotspot.debugger.linux.LinuxDebuggerLocal$LinuxDebuggerLocalWorkerThread.run(LinuxDebuggerLocal.java:138)
I rediscovered this SO post which suggested that I would need to run the following:
$ echo 0 | sudo tee /proc/sys/kernel/yama/ptrace_scope
(note, not in the Docker container but on the actual host itself)
Strangely enough, now I was back to the Metadata does not appear to be polymorphic error, even though I was running as the correct user. jcmd gave me these errors, as root:
root@my-docker-container:/dist# jcmd 31857 GC.heap_dump java.hprof
31857:
com.sun.tools.attach.AttachNotSupportedException: Unable to open socket file: target process not responding or HotSpot VM not loaded
    at sun.tools.attach.LinuxVirtualMachine.<init>(LinuxVirtualMachine.java:106)
    at sun.tools.attach.LinuxAttachProvider.attachVirtualMachine(LinuxAttachProvider.java:63)
    at com.sun.tools.attach.VirtualMachine.attach(VirtualMachine.java:208)
    at sun.tools.jcmd.JCmd.executeCommandForPid(JCmd.java:147)
    at sun.tools.jcmd.JCmd.main(JCmd.java:131)
...and as non-root:
ecraft@my-docker-container:/dist$ jcmd 31857 GC.heap_dump java.hprof
31857:
Permission denied
I also tried the following form, as suggested by someone:
ecraft@my-docker-container:/dist$ jmap -heap 31857
Attaching to process ID 31857, please wait...
Debugger attached successfully.
Server compiler detected.
JVM version is 25.131-b11

using thread-local object allocation.
Parallel GC with 2 thread(s)

Heap Configuration:
   MinHeapFreeRatio         = 0
   MaxHeapFreeRatio         = 100
   MaxHeapSize              = 4294967296 (4096.0MB)
   NewSize                  = 805306368 (768.0MB)
   MaxNewSize               = 805306368 (768.0MB)
   OldSize                  = 805306368 (768.0MB)
   NewRatio                 = 2
   SurvivorRatio            = 8
   MetaspaceSize            = 21807104 (20.796875MB)
   CompressedClassSpaceSize = 1073741824 (1024.0MB)
   MaxMetaspaceSize         = 17592186044415 MB
   G1HeapRegionSize         = 0 (0.0MB)

Heap Usage:
Exception in thread "main" java.lang.reflect.InvocationTargetException
    at sun.reflect.NativeMethodAccessorImpl.invoke0(Native Method)
    at sun.reflect.NativeMethodAccessorImpl.invoke(NativeMethodAccessorImpl.java:62)
    at sun.reflect.DelegatingMethodAccessorImpl.invoke(DelegatingMethodAccessorImpl.java:43)
    at java.lang.reflect.Method.invoke(Method.java:498)
    at sun.tools.jmap.JMap.runTool(JMap.java:201)
    at sun.tools.jmap.JMap.main(JMap.java:130)
Caused by: java.lang.RuntimeException: unknown CollectedHeap type : class sun.jvm.hotspot.gc_interface.CollectedHeap
    at sun.jvm.hotspot.tools.HeapSummary.run(HeapSummary.java:144)
    at sun.jvm.hotspot.tools.Tool.startInternal(Tool.java:260)
    at sun.jvm.hotspot.tools.Tool.start(Tool.java:223)
    at sun.jvm.hotspot.tools.Tool.execute(Tool.java:118)
    at sun.jvm.hotspot.tools.HeapSummary.main(HeapSummary.java:49)
    ... 6 more
As suggested by a colleague (thanks, Richard!) I installed the openjdk-8-dbg package and now it worked a lot better:
# sudo -u ecraft jmap -dump:format=b,file=heapdump-20180315 -F 31857
Attaching to process ID 31857, please wait...
Debugger attached successfully.
Server compiler detected.
JVM version is 25.131-b11
Dumping heap to heapdump-20180315 ...
(At this point I had to abort the dump, since it halted the application server in the production environment.)
Step #2: Successfully being able to generate the heap dump
A couple of months later, the problem appeared again; this time in a test
environment, where it was slightly easier to debug it in a controlled
fashion. The first challenge was to be able to install the exact right
version of openjdk-8-dbg, matching my currently-running JDK version. The
.deb package was gone, likely because the Java 8 patchlevel here was so
old. But, Google helped me find a
mirror
that still had the file there.
Hmm, weird enough: jmap wasn't a part of that package. apt-file to the
rescue:
$ apt-file update && apt-file search jmap
[...]
openjdk-8-jdk-headless: /usr/lib/jvm/java-8-openjdk-amd64/bin/jmap
So, I apparently needed that file also. Luckily, that same Debian mirror had this package cached there also, of the correct-but-old version.
I got the same Can't attach to the process: ptrace(PTRACE_ATTACH, ..)
failed error as previously, and was glad that I had documented it to
myself some three months earlier. ![]()
Now, I managed to create the heapdump with little effort (again, I was glad that I had saved the exact command line from the last time.) It just took quite a long time; I think a couple of hours or so.
$ sudo -u ecraft jmap -dump:format=b,file=heapdump-20180628 -F 46
Attaching to process ID 46, please wait...
Debugger attached successfully.
Server compiler detected.
JVM version is 25.131-b11
Dumping heap to heapdump-20180628 ...
Step #3: Analyzing the dump
I took the easy road and used Eclipse MAT this time, since it's the Java profiling tool that I know best; some of its features are nice and helpful in the process. Opening up the 2 GiB heap dump took a good while since MAT builds some indices etc. for the file along the process.
Here is what the Leak Suspects gave at first glance:
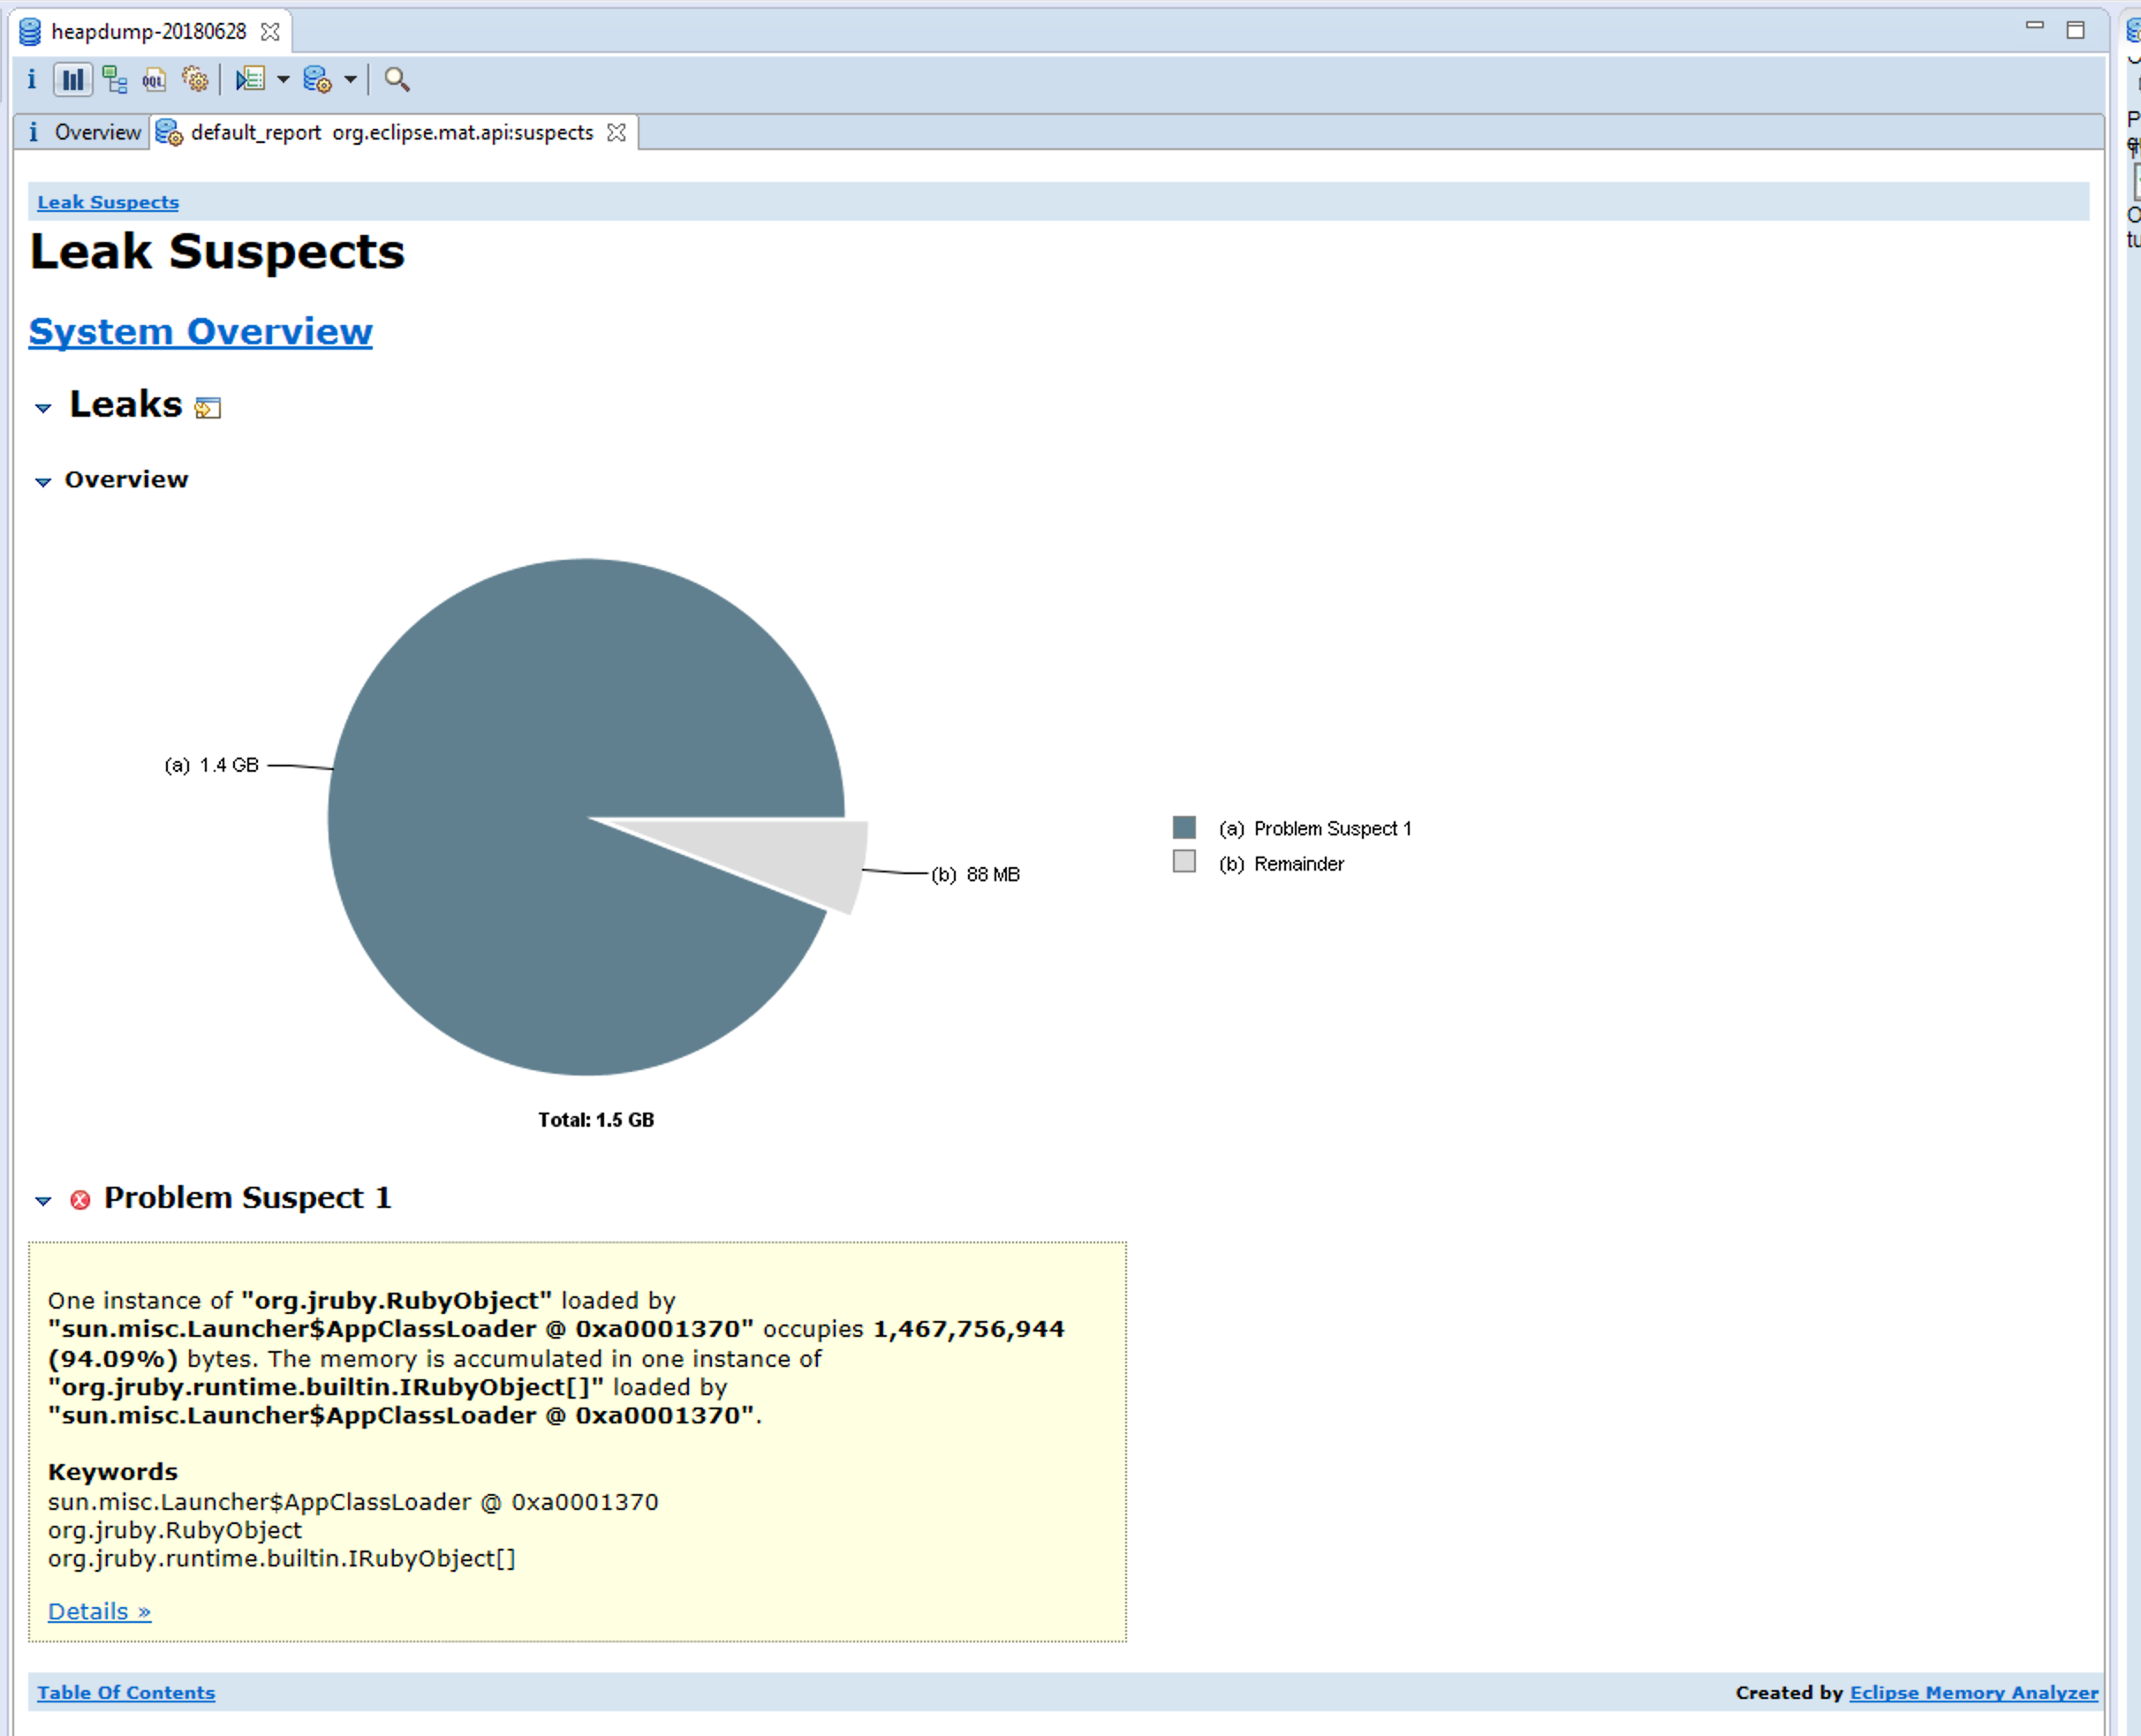
There seems to be a pretty clear suspect here, right?
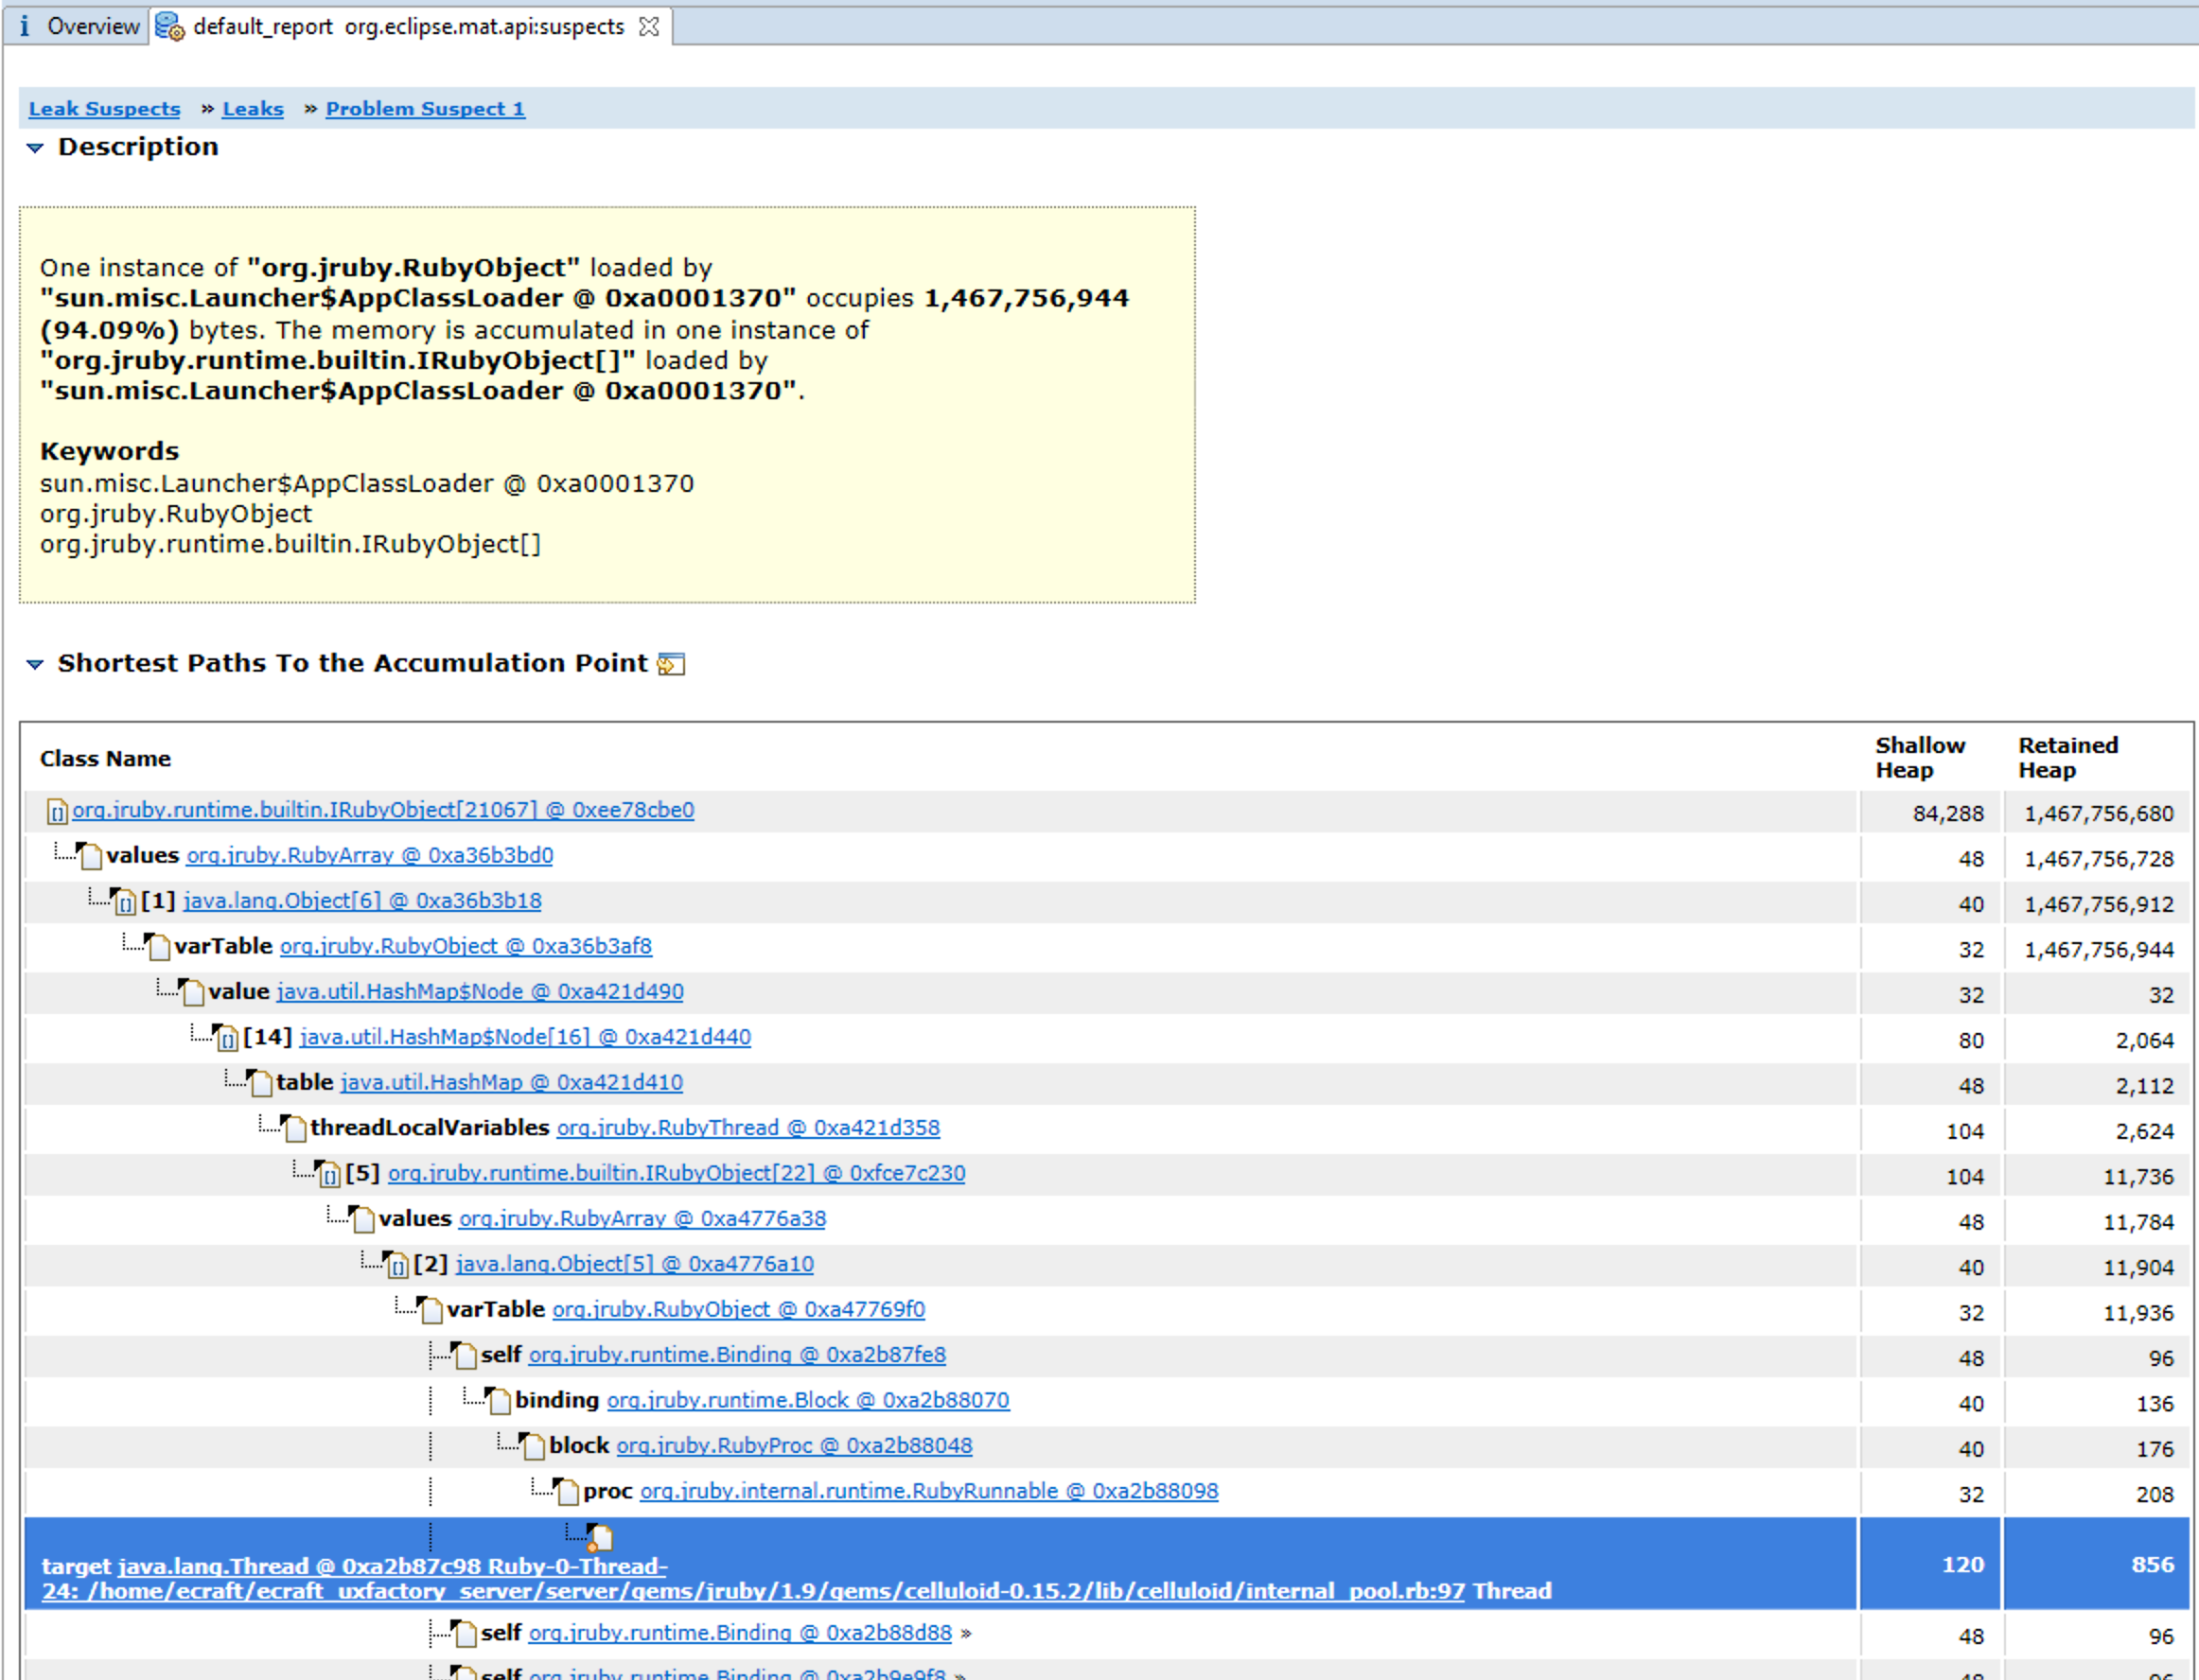
Looking at the "Shortest Paths To the Accumulation Point" included Celluloid in the tree, but that doesn't prove that Celluloid is indeed part of the problem - just that it could be.
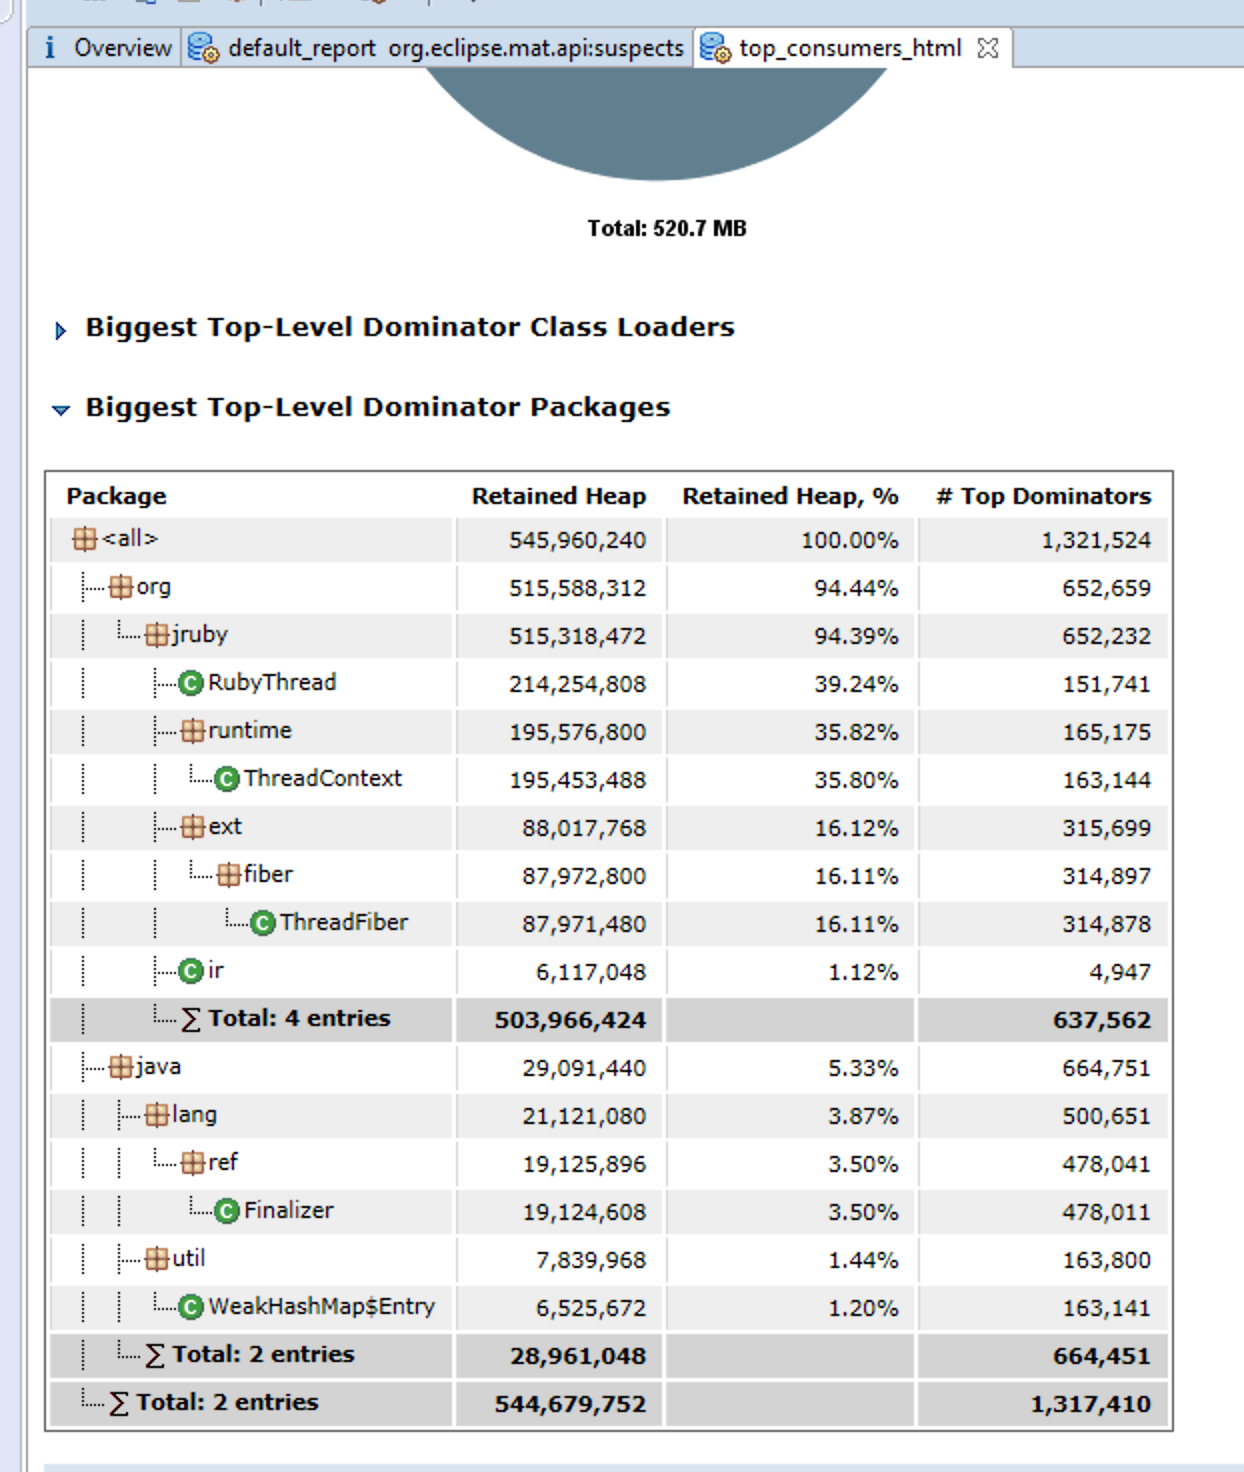
Using the context menu "Java Basics -> Show in Dominator Tree" brought up this very interesting view.
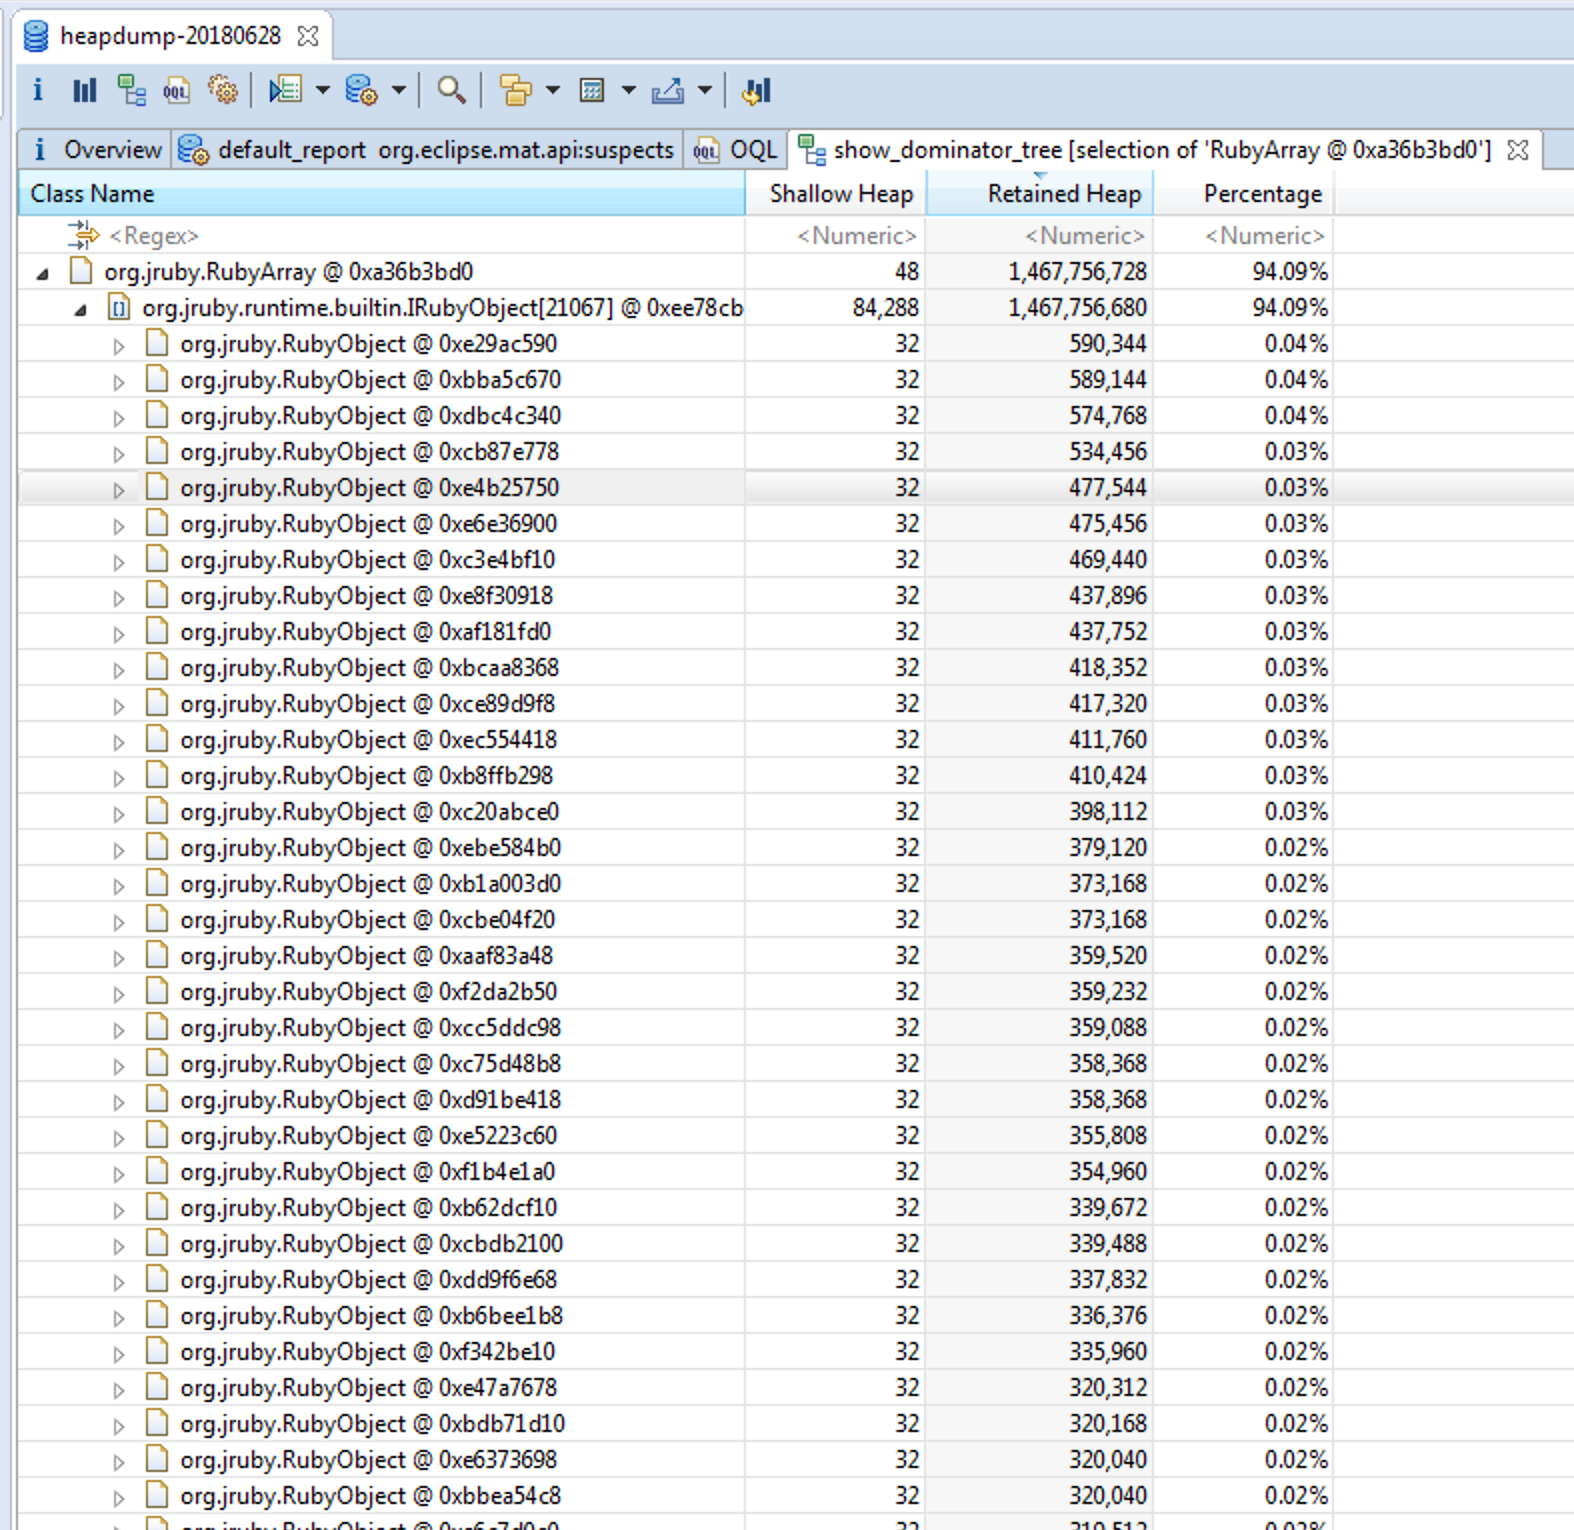
Okay, so let's summarize what we know for a fact right now:
- We have a huge RubyArray, using up about 94% of the total heap.
- It contains 21067 items.
- The largest items seems to be 320-590 KiB large. 320 KiB is 0.02% of the total heap being used, so (quickly counting in my head) 50 * 100 = 5000 such objects would lead to 100% of the heap. Now, many of these objects are likely smaller objects which explains why they "only" use up 94% for 21067 items.
So what are these RubyObjects anyway?
OQL to the rescue
I came up with an initial OQL query based on what I learned from a previous analysis:
SELECT metaClass.cachedName.toString() FROM org.jruby.RubyObject
This query gave me the following output:
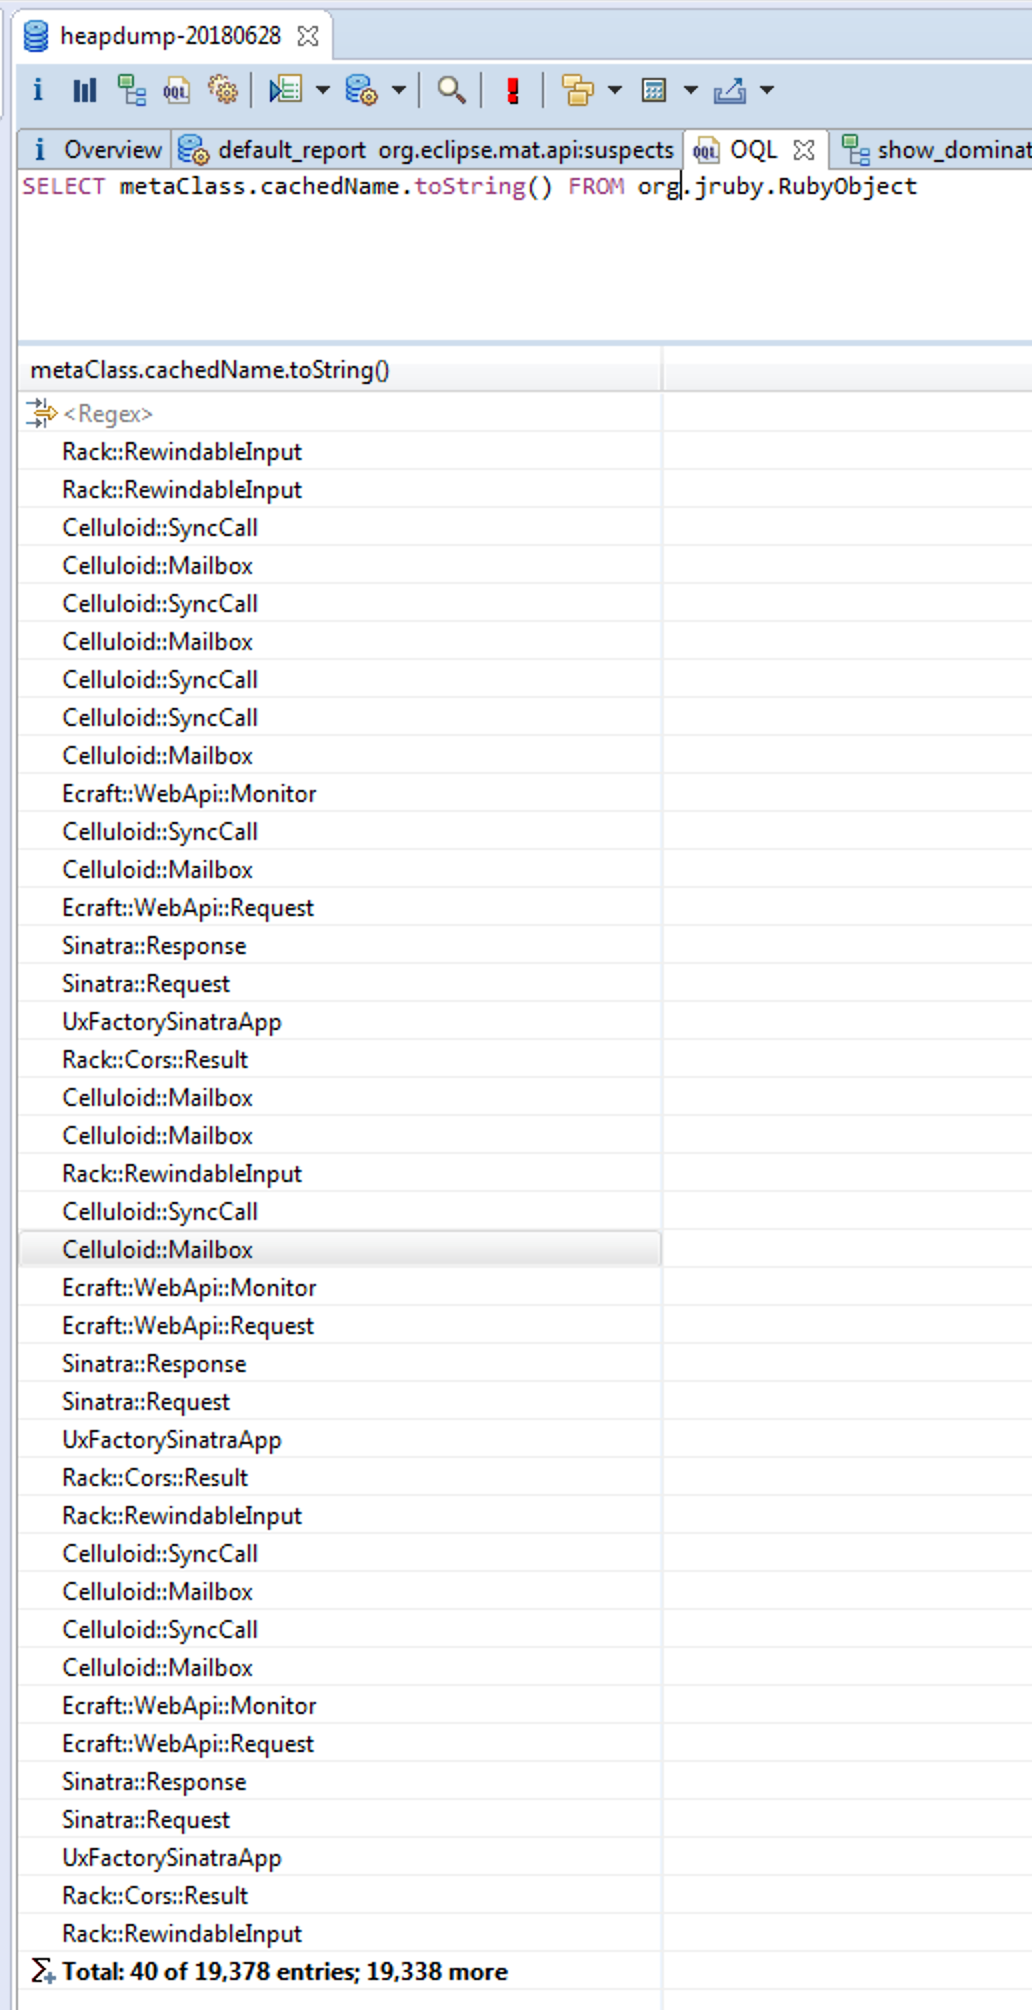
I used some Unix shell tools to see the main offender here. As suspected, Celluloid seems to be, if not at fault, at least involved in the problem.
$ cat oql1.csv | sort | uniq -c | sort -n -r | head -n20
  16822 Celluloid::AsyncCall,
   1643 MIME::Type,
     52 Celluloid::Mailbox,
     48 Gem::Requirement,
     48 Celluloid::SyncCall,
     44 Set,
     42 Rack::RewindableInput,
     40 Rack::Cors::Result,
     40 Ecraft::WebApi::Monitor,
     39 UxFactorySinatraApp,
     39 Ecraft::WebApi::Request,
     38 Sinatra::Response,
     38 Sinatra::Request,
     33 ,
     26 Gem::Dependency,
     25 Gem::Version,
     20 Timers,
     20 SortedSet,
     17 MxFactory::Pipelines::RubyPipeline,
     12 Celluloid::ThreadHandle,
I used the "Calculate minimum retained size" function in OQL to get the approximate Retained Heap for these AsyncCall objects. To then summarize these, I took the simplest way and (don't laugh!) used Microsoft Excel to see the total heap usage of all these AsyncCall objects.
This led me to the conclusion that of the total heap size of 1,5 GiB as shown above, about 1,37 GiB was being used by these objects in particular. I also discovered https://github.com/celluloid/celluloid/issues/770, where another Celluloid user ran into issues with leaks - not exactly the same use pattern, but still.
"Just one more little thing..."
Before wrapping up, I wrote the following little Ruby script to see if it would mayhaps trigger the leaking?
require 'bundler/setup'
require 'celluloid'
require 'celluloid/autostart'

class Subscriber
  include Celluloid
  include Celluloid::Notifications

  def initialize
    subscribe('errors', :error)
    puts 'Subscriber initialized'
  end

  def error(topic, data)
    #puts 'got it'
  end
end

class Publisher
  extend Celluloid::Notifications

  def self.publish_message(error)
    publish(
      'errors',
      error: error
    )
  end
end

p Celluloid::VERSION

subscriber = Subscriber.new

loop do
  Publisher.publish_message('dummy error')
end
Interestingly enough, this is what it looked like after just running it for a few minutes (the first entry in the list):
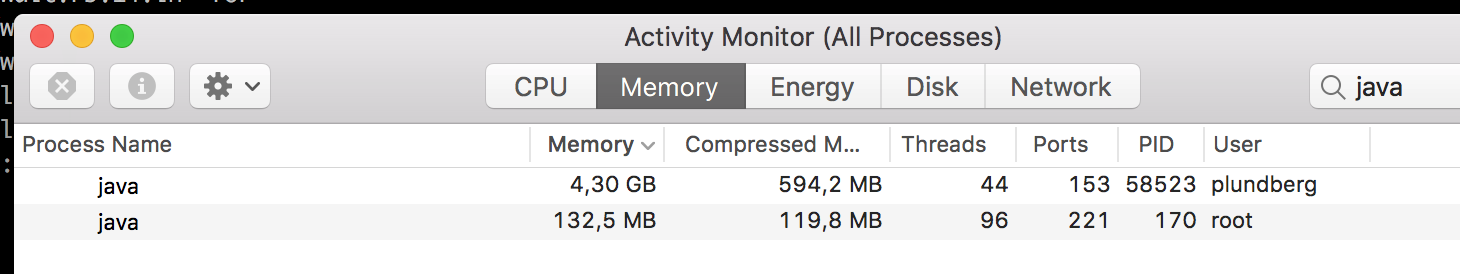
But: it seemed to stop at 4.30 GiB for whatever reason. Anyhow, I created
a heap dump of this process also - of course, I had to use a completely
different command this time but jmap was friendly enough to at least hint me about
the right direction...
$ jmap -dump:format=b,file=heapdump-20180702 -F 58523
Error: -F option used
Cannot connect to core dump or remote debug server. Use jhsdb jmap instead
$ jhsdb jmap --pid 58523 --binaryheap --dumpfile heapdump-20180702
Attaching to process ID 58523, please wait...
Debugger attached successfully.
Server compiler detected.
JVM version is 10.0.1+10
Unfortunately though, dumping the heap using the method above took ages.
jcmd 66135 GC.heap_dump macos-heapdump was a lot faster.
The overview I got in Eclipse MAT was surprisingly rather different this time; I was running it with a different JRuby and Java version, which may have effected the outcome. (The customer environment is running on an older 1.7 JRuby with Java 8.)
However, what I did see was this:
A large group of threading-related objects in JRuby being retained, and my guess would be that it's because of a bug in Celluloid and/or JRuby. Funny thing: the script shown above does not leak any memory whatsoever on MRI Ruby. Sooo... this is likely why nobody has fixed it as of yet; JRuby is unfortunately much less commonly used than MRI Ruby and Celluloid likely works much better on MRI in this regard.
Wrapping up/conclusion
As far as I was concerned, the analysis was over. We were looking into the root cause, and we could conclude that Celluloid/JRuby, or our potentially defective usage of Celluloid/JRuby, was the cause here. However, since a very plain-and-simple Celluloid script would show similar tendencies with JRuby, I would be more inclined to lean towards the former.
I did also update the previously mentioned GitHub issue with my findings; even though I didn't personally have a chance to dig much deeper into this right now, it could always help some other people and maybe help resolving the underlying root cause. Who knows, perhaps it will even help me someday?